Data and Charts
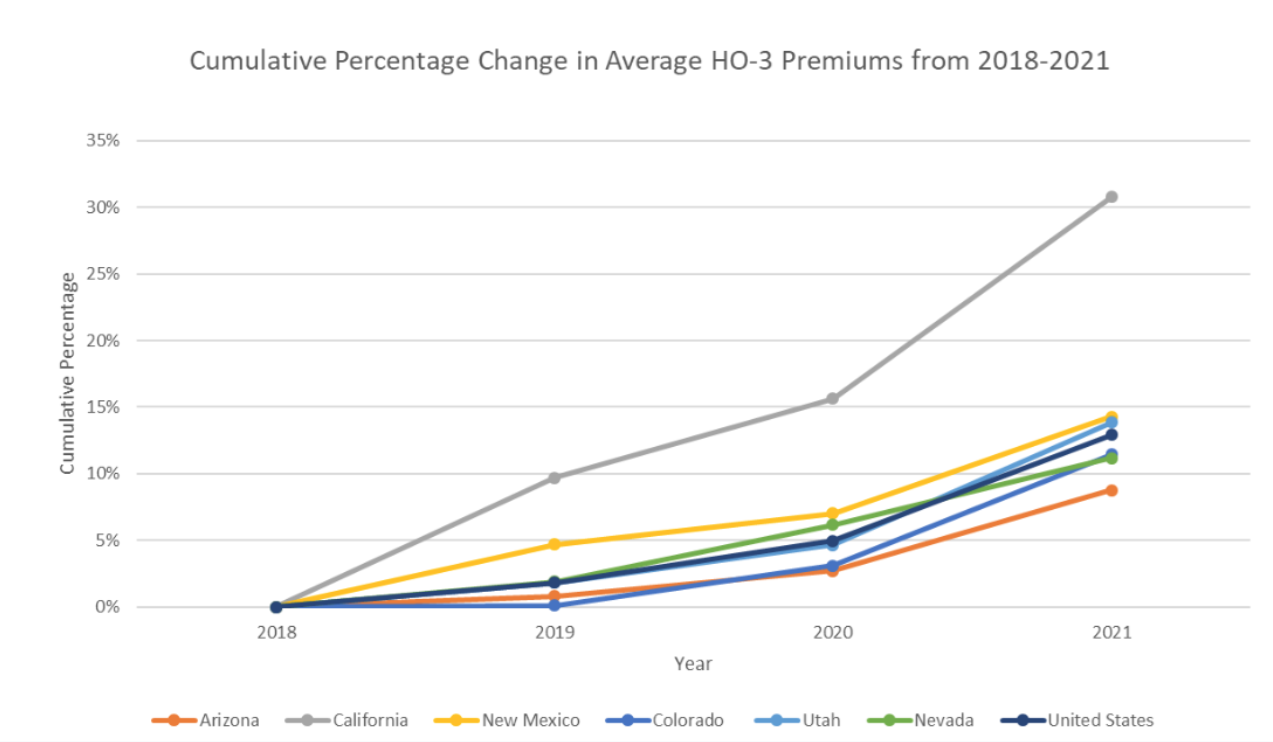
This graph displays the cumulative percentage change in average HO-3 premiums from 2018 through 2021* (HO-3 is the most common category of homeowners insurance policy) and is the most current data available from the National Association of Insurance Commissioners (NAIC). As demonstrated in the graph, California’s homeowner premiums have outpaced other southwestern states as well as the national average. While California is an outlier, homeowners premiums are generally trending upwards among all states represented and the nation as a whole.
*This data is nominal average HO-3 premiums that are unadjusted for inflation
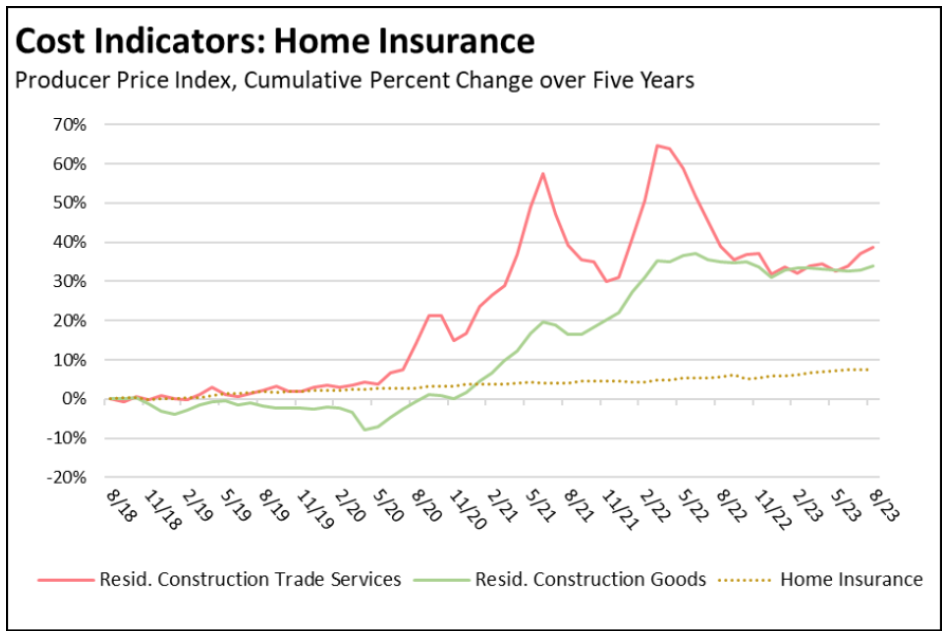
This graph displays the rising cost of construction, both in materials and labor. Beginning in 2020, costs for these two categories began rising significantly, likely due in part to pandemic-related disruptions. The dotted line plots the national cumulative cost increases related to homeowners insurance adjusted for inflation. While the cost of homeowners insurance has not kept pace with the cost of construction, the trend line indicates an acceleration of homeowners insurance price increase as the months and years progress. The data on this graph is from the American Property and Casualty Insurance Association (APCIA) and is reasonably current (August 2023).
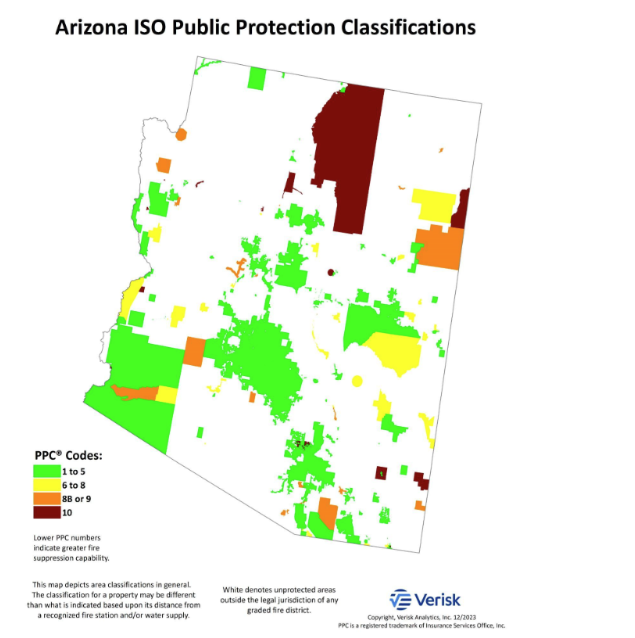
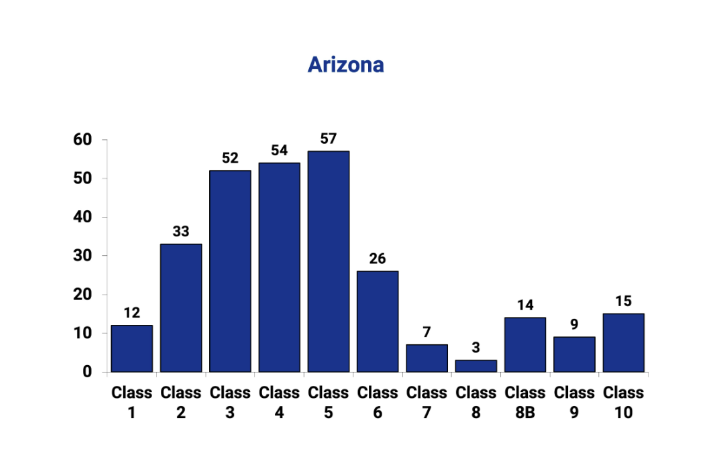
Insurers commonly use the Insurance Services Organization (ISO) Public Protection Classification (PPC) to determine risk of loss due to fire and price fire insurance based on the classification.
Classes range from 1 (best) to 10 (worst) and are determined by a community’s fire prevention and suppression capabilities, based on:
- fire departments/districts
- water resources
- emergency communications
- community risk reduction
This graph represents the Public Protection Classification (PPC) attributed to certain Arizona communities. Thirty-eight (38) Arizona communities – those within the jurisdiction of a graded fire department or district – are classified as 8B or worse, which indicates a higher relative wildfire risk. It’s also worth noting that an individual property may have a different classification than that of the community in which it is located due to distance from a fire station, water source, or other contributing risk factors. Insurers typically will not insure homes graded as Class 10.